Blog
Pie Chart
- June 20, 2020
- Category: Pie Chart
Pie Chart
V. The following pie-chart shows the sources of funds to be collected by the National Highways Authority of USA ( NHAI ) for its Phase III projects. Study the pie-chart and answer the questions that follow.
SOURCES OF FUNDS TO BE ARRANGED BY NHAI
FOR PHASE III PROJECTS ( IN CRORES $ )

Total funds to be arranged for Projects ( Phase III ) = Rs. 64,032 crores.
1 Near about 30 % of the funds are to be arranged through :
(a) SPVS (b) External Assistance (c) Annuity (d) Market Borrowing
2 The approximate central angle corresponding to annuity is :
(a) 24.5 (b) 142.5 (c) 182.7 (d) 192.4
3 The approximate ratio of the funds to be arranged though Toll and that through Market Borrowing is :
(a) 2 : 9 (b) 1 : 7 (c) 3 : 11 (d) 2 : 5
4 If NHAI could receive a total of Rs. 14935 crores as External Assistance, by what percent ( approximately ) should it increase the Market Borrowings to arrange for the shortage of funds ?
(a) 5.5 % (b) 8.5 % (c) 9 % (d) 10 %
5 If the toll is to be collected through an outsourced agency by allowing a maximum 20 % commission, how much amount should be permitted to be collected by the outsourced agency, so that the project is supported with Rs. 4350 crores ?
(a) Rs. 6213 crores (b) Rs. 5827 crores
(c) Rs. 5440 crores (d) Rs. 5216 crores
(V) The pie-chart provided below gives the distribution of land ( in a village ) under various food crops. Study the pie-chart carefully and answer the questions that follow.
DISTRIBUTION OF AREAS ( IN ACRES ) UNDER VARIOUS FOOD CROPS

In above pie–chart all the number denotes angles ( in degree )
6. Which combination of three crops contribute approximately to 42 % of the total area under the food crops ?
(a) Wheat, Barley and Jowar (b) Rice, Wheat and Jowar
(c) Rice, Wheat and Barley (d) Bajra, Maize and Rice
7. If the total area under Jowar was 2 million acres, then what was the area ( in million acres ) under rice ?
(a) 7.5 (b) 6 (c) 8 (d) 10
8. If the production of wheat is 8 times that of barley, then what is the ratio between the yield per acre of wheat and barely ?
(a) 5 : 4 (b) 4 : 1 (c) 3 : 2 (d) None of these
9. If the yield per acre of rice was 60 % more than that of barley, then the production of barley is approximate what percent of that of rice ?
(a) 37 % (b) 27 % (c) 28 % (d) 31 %
10. If the total area goes up by 50 %, and the area under wheat production goes up by 20 %, then what will be the angle for wheat in the new pie-chart ?
(a) 70 (b) 64 (c) 68 (d) 65.33
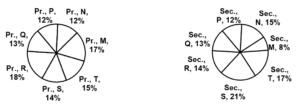
The following pie-charts show the distribution of students of Primary and Secondary levels in seven different institutes – M, N, P, Q, R, S and T in a town.
distribution of students at Primary and Secondary levels in seven institutes – M, N, P, Q, R, S and t.
Total Number of Students of Total Number of Students of
Primary Level = 40000 Secondary Level = 30000

11 How many students of institutes M and S are studying at primary level ?
(a) 7516 (b) 12400 (c) 11500 (d) 13000
12 Total number of students studying at secondary level from institutes N and P is :
(a) 8109 (b) 8904 (c) 8100 (d) 7004
13 What is the total number of primary and secondary level students in institute R ?
(a) 11500 (b) 11000 (c) 12000 (d) 11400
14 What is the ratio between the number of students studying at secondary and primary level respectively from institute S ?
(a) 7 : 8 (b) 9 : 28 (c) 9 : 8 (d) 13 : 8
15 What is the ratio between the number of students studying at secondary level from institute S and the number of students studying at primary level from institute Q ?
(a) 63 : 48 (b) 61 : 72 (c) 9 : 8 (d) 63 : 52
