Blog
Venn Diagrams
☼ Venn Diagrams : We represent sets by closed bounded figures, known as Venn diagrams. The universal set is denoted by a rectangular region and each subset of it is shown by a closed bounded figure within this rectangle.
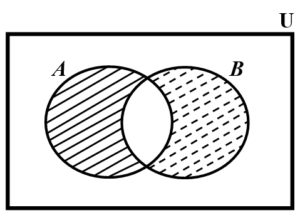
Case I : When A U, B
U and A
B
. In this case Venn diagram consists of two interesting bounded figures within a rectangular region, representing A and B respectively.
We have depicted the regions of ( A – B ),
( A B) and ( B – A )
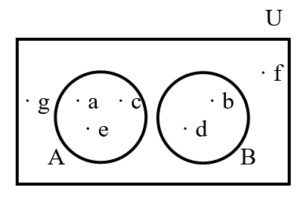
■ Case II : When A U, B
U and
A B =
.
In this case, the Venn diagram consists of two closed non-intersecting figures lying within a rectangular region.
In this case, A B =
, A – B = A & B – A = B.
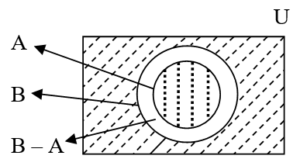
■ Case III : When A B
U.
In this case, the Venn diagram has been shown in the adjoining figure.
Clearly, A B = B, A
B = A & A – B =
.